
Statistics Graph & Campaign Chart
How to compare two metrics over a custom date range and how to read the campaign performance table.
Last updated September 1, 2026
Watch
Where to Find Campaign Statistics
Navigate the Statistics Graph and Campaign Chart to compare metrics over a custom date range.
Statistics Graph
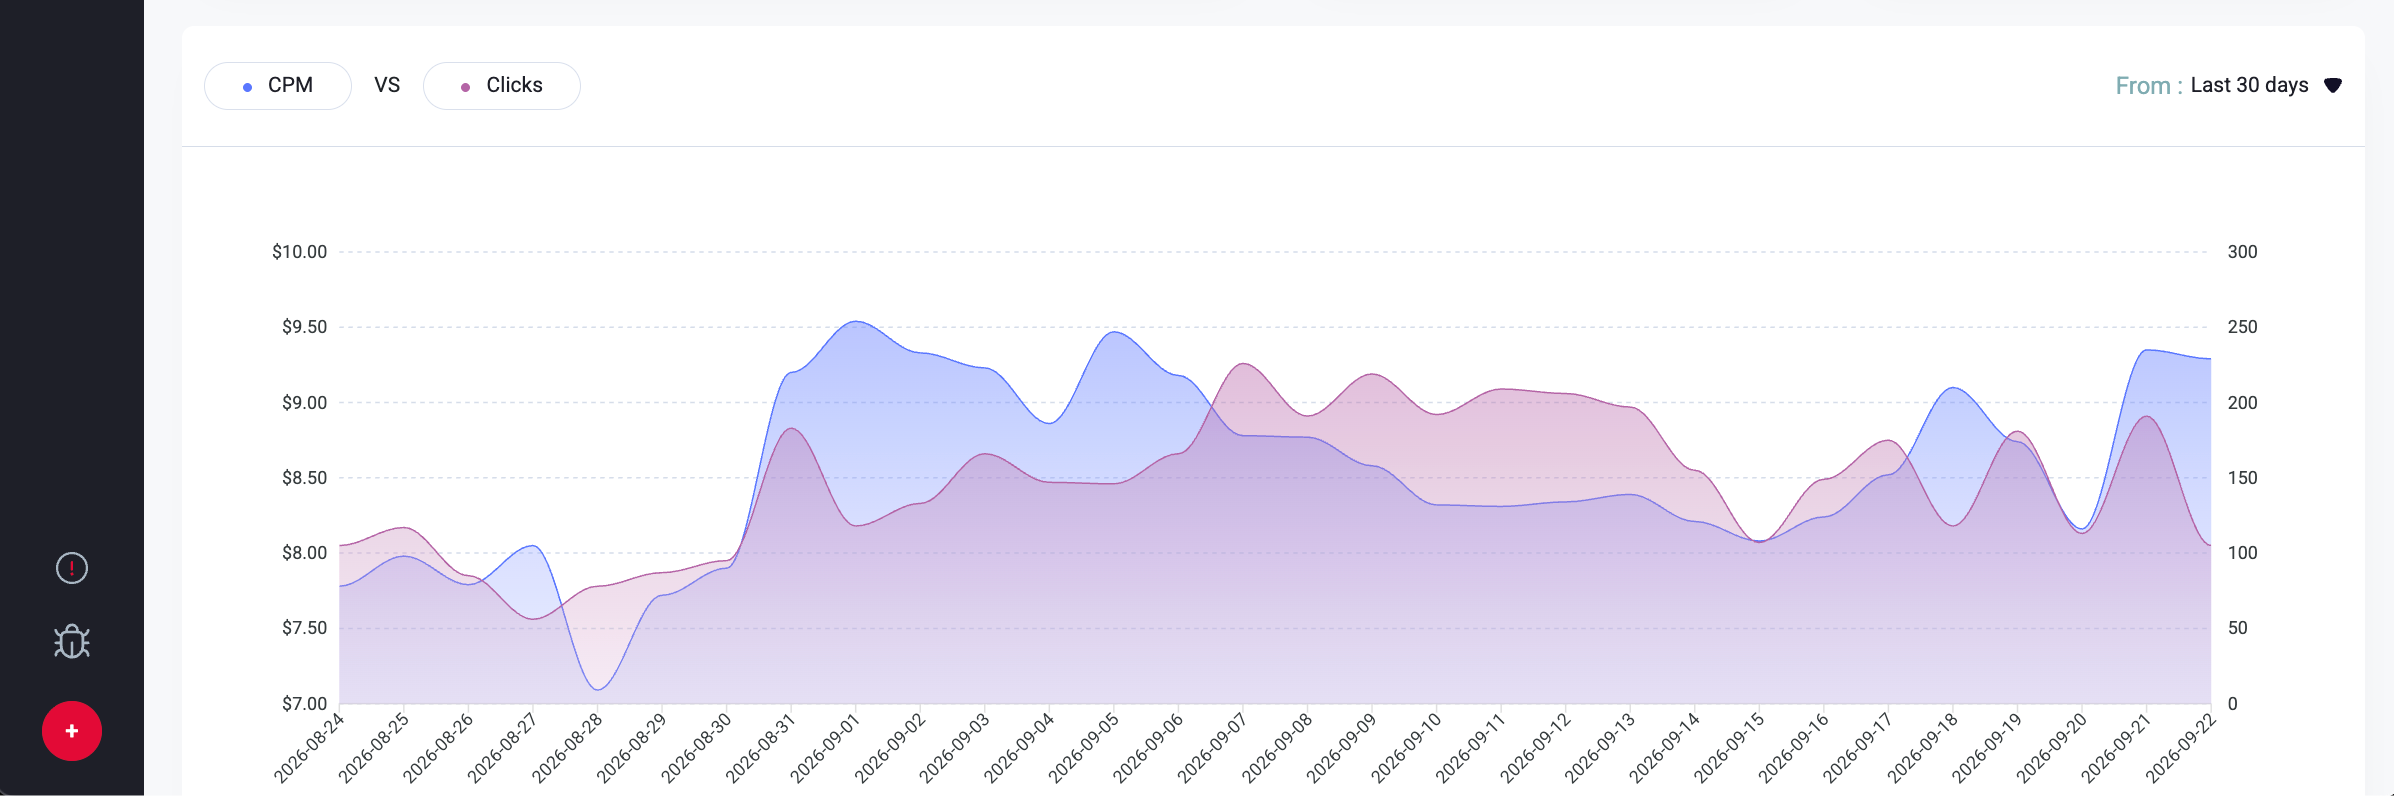
The Statistics Graph lets you compare two metrics side-by-side over a custom date range. Use the two metric selectors above the graph to choose which metrics to plot. Available metrics: Cost, Clicks, CPC, CPM, Impressions, Video Impressions, Views, CPV, VTR. Change the date range using the date picker. The Download CSV Report button exports the data for the selected metrics and date range.
Campaign Chart
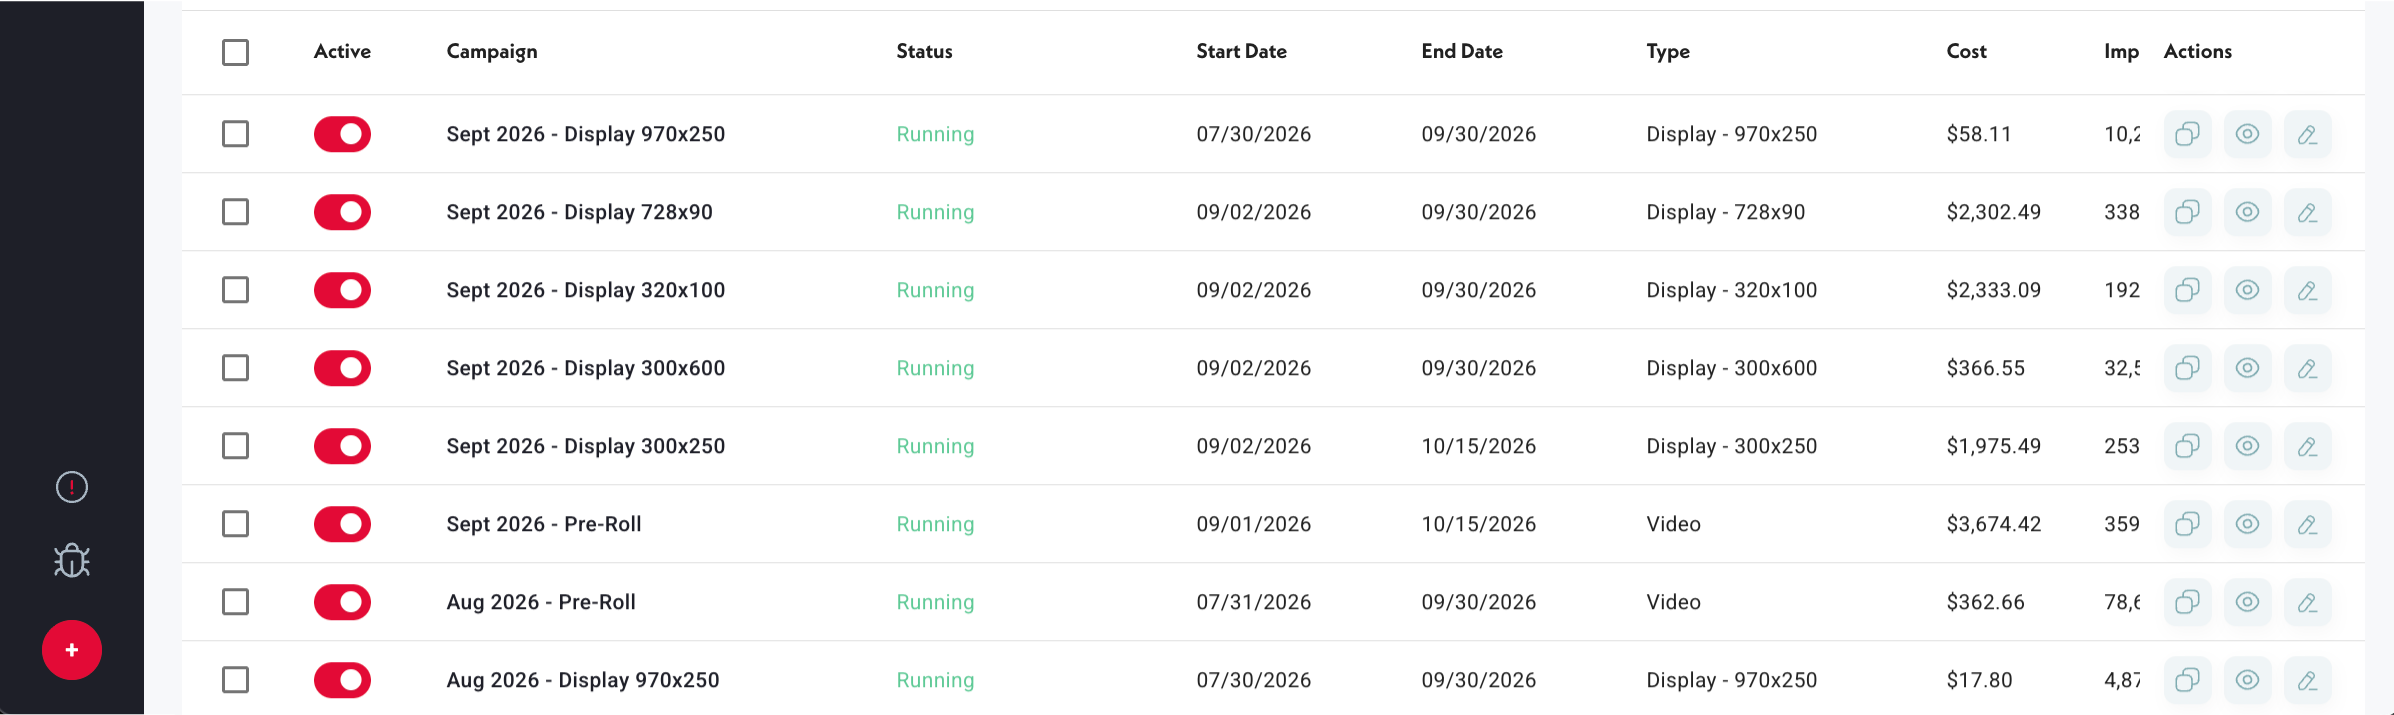
The Campaign Chart lists all campaigns — active and inactive — in your account. Each row shows: Start Date, End Date, Cost, Impressions, Clicks, CPM, CPC, CTR, Conversions, Video Views, and Status. Click any campaign name to see its detail. Use the Status column to filter active vs. inactive campaigns. The action icons at the far right let you Preview, Edit, or Delete each campaign.
Common Mistakes
- 1Comparing two metrics with very different scales on the same graph and misreading the trend — the Statistics Graph plots both metrics on a shared axis. If one metric (e.g. Impressions, in thousands) vastly outscales the other (e.g. Clicks, in single digits), the lower-scale metric's trend line appears nearly flat even if it is rising meaningfully. Read the numerical labels on each axis, not just the visual slope.
- 2Forgetting that the date range picker affects both the graph and the Campaign Chart — changing the date range updates what both views show. If you narrow the date range to investigate a specific week, the Campaign Chart will reflect that period too, which can make campaigns with no spend in that window appear to have zero lifetime performance.
- 3Treating Cost in the Campaign Chart as a real-time number — there may be a short processing lag between spend occurring and it appearing in the chart. For very recent campaigns, allow some time before concluding delivery has stopped based on a flat cost figure.
Was this helpful?