
Exporting CSV Reports
Download campaign data as a CSV from the Statistics Graph for use in spreadsheets or external tools.
Last updated September 1, 2026
How to Export a CSV Report
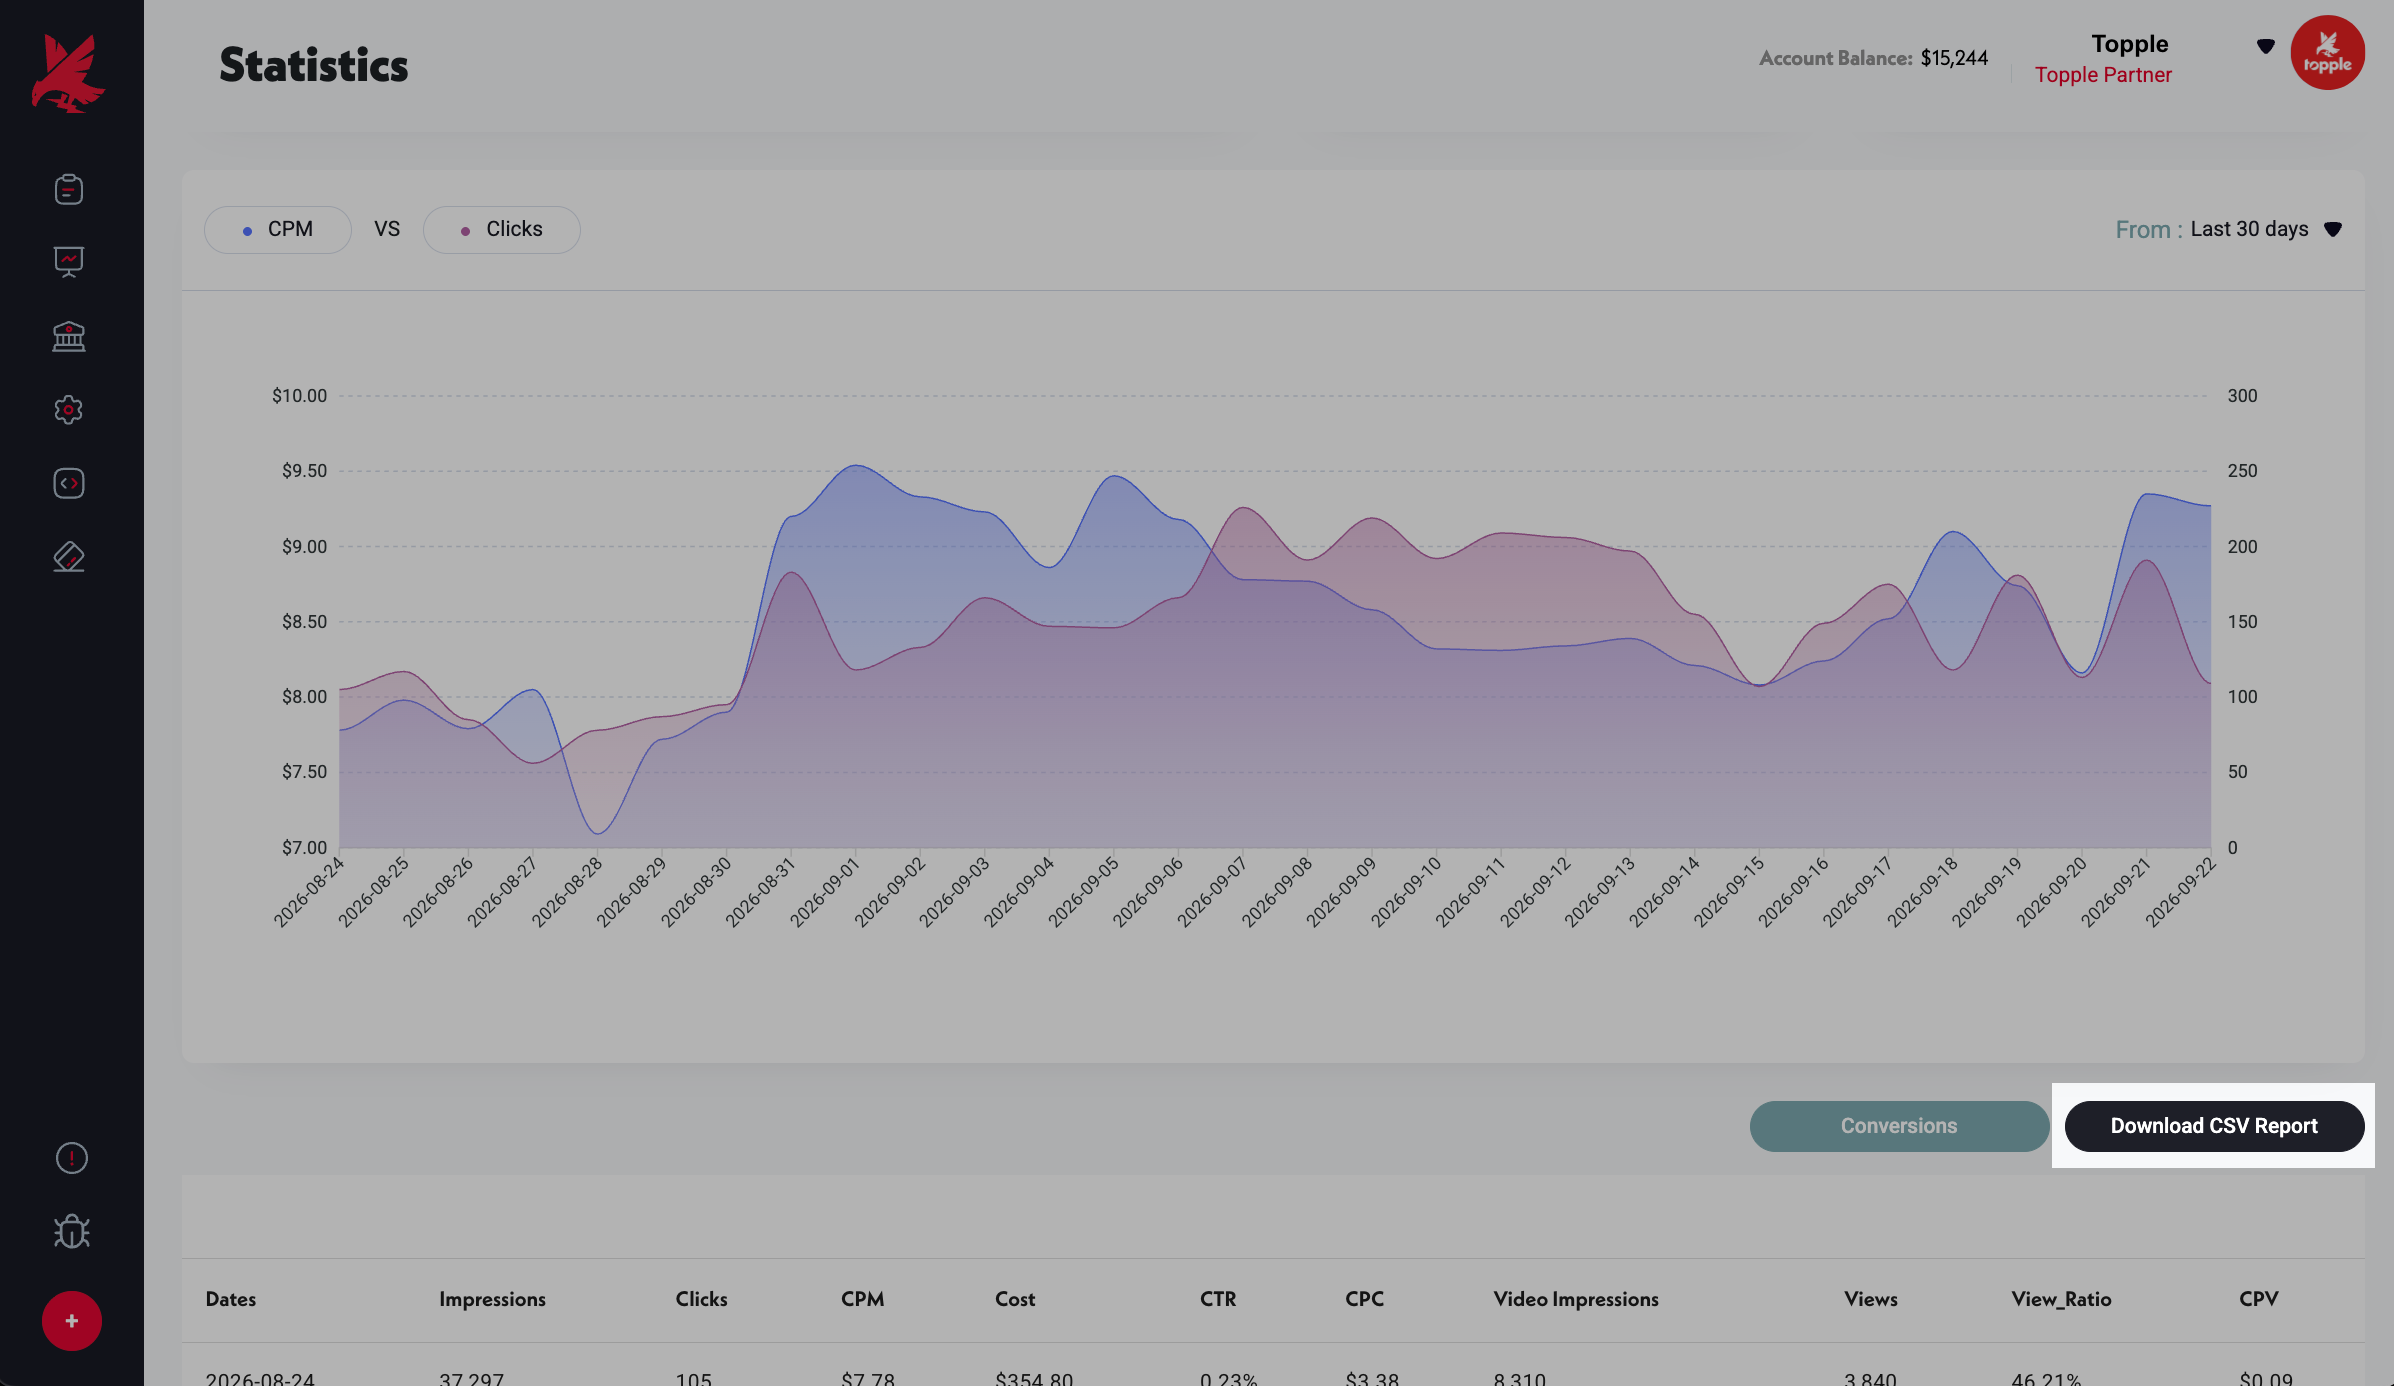
- 1Go to your dashboard.
- 2In the Statistics Graph, select the two metrics you want to export.
- 3Set the date range for the data you want.
- 4Click the Download CSV Report button below the graph.
- 5Topple generates and downloads a CSV file with the selected metrics over your chosen date range.
What Is Included in the Export
The CSV includes the two metrics selected in the Statistics Graph, broken down by day over the selected date range. Each row represents one day. If you need a different breakdown (by campaign, by creative), you may need to pull data from the Campaign Chart or Variations tab separately.
Common Mistakes
- 1Expecting a full data export — the CSV reflects only the two metrics currently selected in the Statistics Graph. It is not a comprehensive dump of all campaign data. If you need metrics not shown (e.g. CPV alongside Impressions), change the metric selectors before exporting.
- 2Exporting before adjusting the date range — the export uses whatever date range is set in the Statistics Graph at the time you click Download CSV Report. If you want lifetime data, set the date range to the full campaign period first.
Was this helpful?